CS 470: Simulated Driving Emergency Braking EEG Recognition
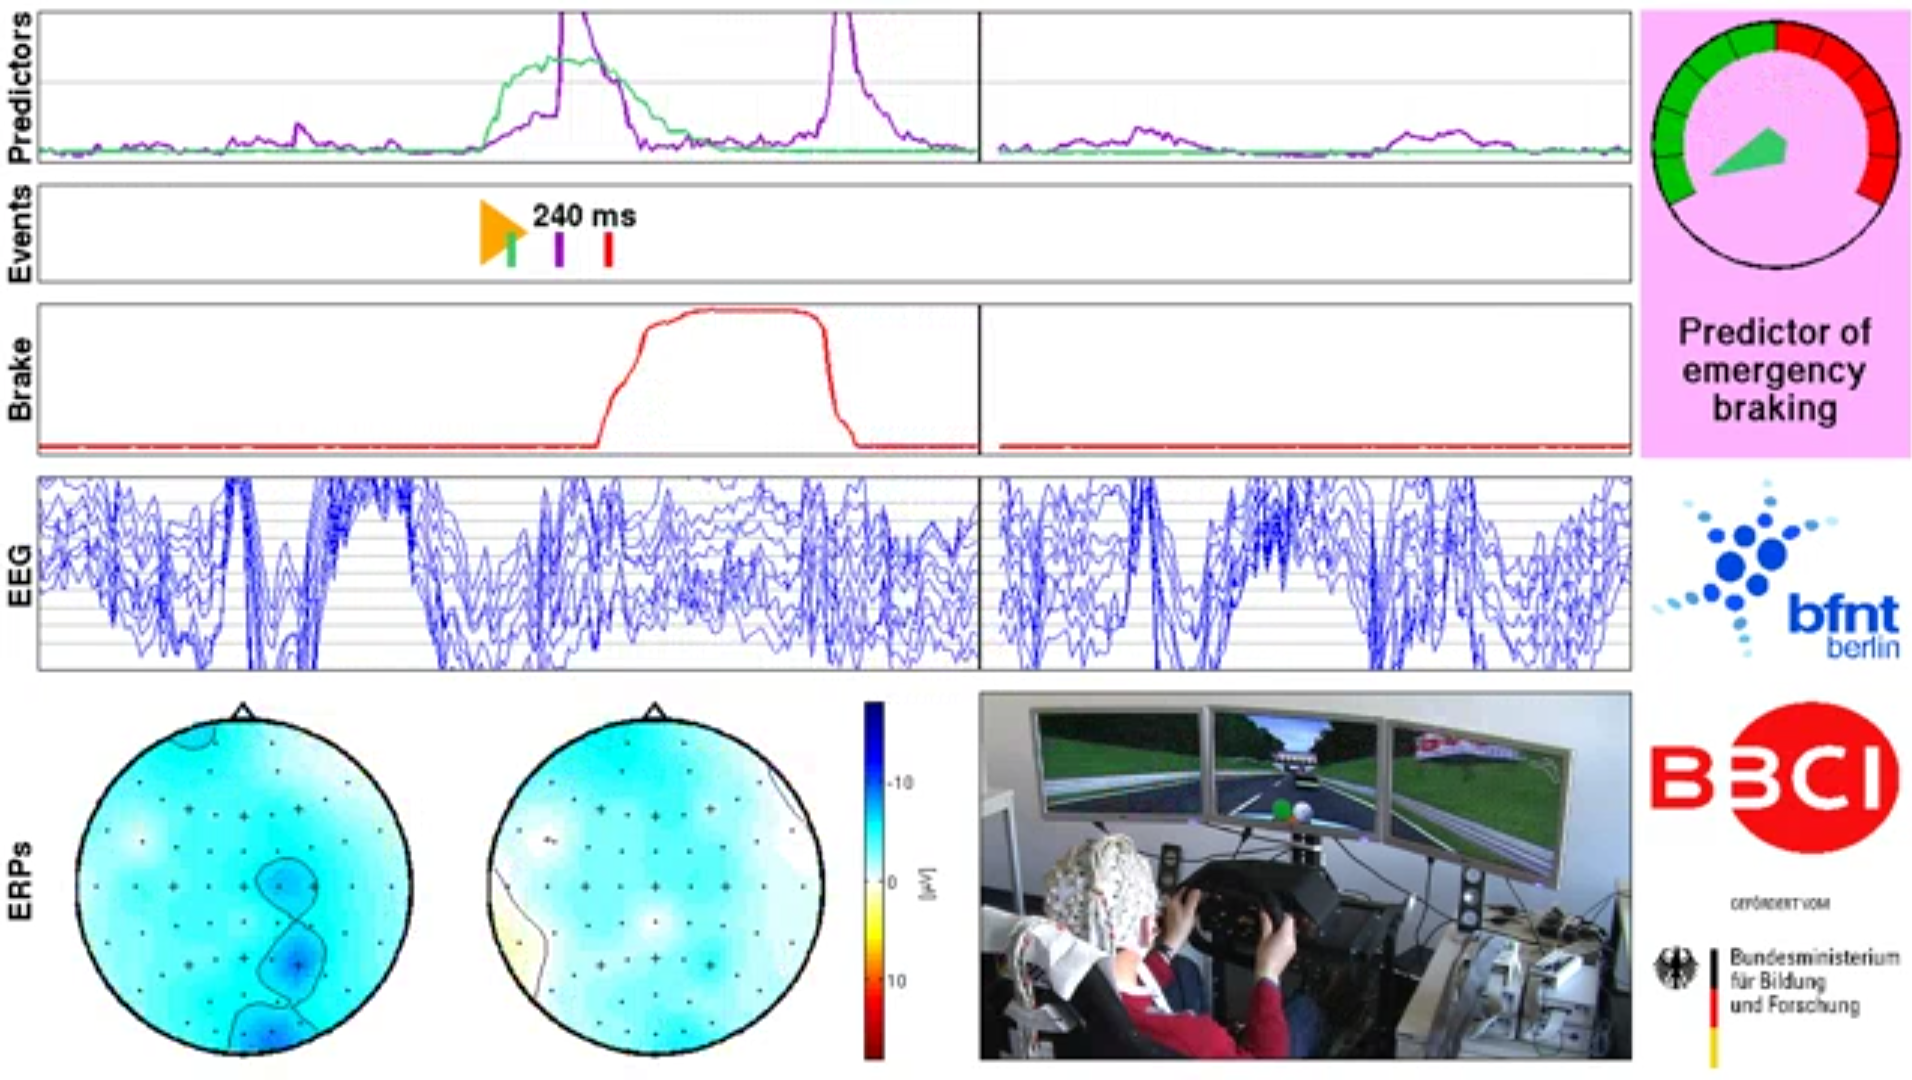
Emergency braking intention detector, Stefan Haufe et al 2011 J. Neural Eng. 8 056001
For our project, we used information taken from a dataset which provided electroencephalogram (EEG) results from an emergency braking simulation. An EEG is a test which utilizes equipment to evaluate electrical activity in the subject's brain. Using the EEG equipment and an intricate driving simulation setup, the researchers conducted 135 minute-long tests on a total of 18 different subjects. Through this process, each subject's time was split into three 45 minute blocks of time to more accurately assess their reaction times. Each subject was instructed to drive a virtual car, keeping within very close proximity to the car in front of them (the lead car). The lead car was programmed to brake abruptly randomly throughout the session, where the driver reacts and brakes in order to prevent a collision. The tests mostly followed a pattern which consisted of:
- The lead vehicle brakes for roughly 500ms (1/2 second).
- The lead vehicle stops braking and coasts at a slow speed.
- The driver brakes in reaction to the lead car braking.
- The lead vehicle accelerates again.
Due to the extensive data and information that was provided by the researchers, we were able to train a classifier which has the ability to detect when a driver is braking abruptly based on the electrical activity in their brain. In order to construct a classifier with such capability, our first task was to discover patterns in the dataset along with useful information provided by the researchers to guide our process of extracting features that represent various events. Through overcoming occasional roadblocks during this process, it allowed for us to proceed reliably into training our classifier with our features and, finally, test untrained subjects to identify whenever the driver is braking.
Approach & Algorithm
As mentioned above, researchers provided a multitude of events within the dataset and the timestamps at which these happen. These events are listed as such: car_brake, car_hold, car_accelerate, car_collision, and react_emg. The first four events are in reference to what the lead car is currently doing at any given point in time, and the fifth is the point in which the driving subject reacts to the lead car braking. Upon this realization, we knew the next task at hand was to solve the problem of aligning the occurrence of all events with the samples of EEG data.
The initial implementation of pulling data around the time of events is shown below. We had chosen the arbitrary value of 500 milliseconds to pull from EEG data, 250 milliseconds before and 250 milliseconds after the event, figuring it would be a sufficient amount of time for the driver to react to the lead car braking. Though, despite this assumption, our classifier was unable to correctly identify when the user braking. We figured we were on the right tracks but our algorithm simply needed some slight refining.
adjustedtime = data{j,1}.mrk.time ./ 5; %mrk.time is in miliseconds, cnt.x samples once every 5 miliseconds
samplerate = ones(cntsize,1); %samplerate vector to hold milisecond intervals
for q = 2:cntsize
	samplerate(q) = samplerate(q-1)+5; %add 5 milisecond more to each index than the previous iteration
end
...
%grab 500ms of eeg data around event
for k = 1:numevents
	if data{j,1}.mrk.y(5,k) == 1 %event 5 is react_emg
            time = adjustedtime(k); %time at which the event occurs
            [~, idx] = min(abs(samplerate-time)); %find closest occurrence of the event in the cnt.x via the samplerate vector
            emgeeg = [emgeeg;data{j,1}.cnt.x(idx-50:idx+50,1:62)]; %grab eeg data within duration
            emgevents = [emgevents;data{j,1}.cnt.x(idx-50:idx+50,63:69)]; %grab event occurrences within duration
Upon further inspection of the documentation of the initial research, we had realized that the occurrence of the driver's reaction to an emergency braking event in the EEG data happens approximately 1300 milliseconds before and 200 milliseconds after the event. The code below reflects this adjustment.
adjustedtime = data{i,1}.mrk.time ./ 5; %mrk.time is in milliseconds, cnt.x samples once every 5 milliseconds
numSkips = 10; %increase to downsample, decrease to upsample
srd = 5; %divisible amount to account for sample rate. For a rate of 200 it would be 5
...
%add label to corresponding raw data
for j = 1:numEvents
	if data{i,1}.mrk.y(5,j) == 1 %event 5 is react_emg
		approx_index = round(adjustedTime(j)/numSkips);
		for k = approx_index-round((1300/srd)/numSkips):approx_index+round((200/srd)/numSkips) %-1300 ms and +200 ms
                	altered_data(k,numEEG+2) = 1; %label as braking
		end
	end
end
Now that we had the correct amount of EEG signal extracted from each event, and each event labeled respectively, the final step before classifying was extracting our desired features. After experimenting with a wide variety, the five we settled on were mean, standard deviation, activity, mobility, and complexity. The code for extracting each is shown below.
ADwindow = altered_data(m:m+targetSize,1:numEEG);
%mean
features(itr,1:numEEG) = mean(ADwindow);
%standard deviation
features(itr,numEEG+1:2*numEEG) = std(ADwindow);
%activity
features(itr,2*numEEG+1:3*numEEG) = var(ADwindow);
%mobility and complexity
for d = 1:numEEG
	ADwd0 = ADwindow(:,d);
	ADwd1 = zeros(1,length(ADwd0));
	ADwd2 = zeros(1,length(ADwd0));
	for d1 = 2:length(ADwd0)
		ADwd1(d1) = ADwd0(d1) - ADwd0(d1-1);
	end
	%mobility
	features(itr,3*numEEG+d) = std(ADwd1)/std(ADwd0);
	for d2=3:length(ADwd0)
		ADwd2(d2) = ADwd0(d2) - 2*ADwd0(d2-1) + ADwd0(d2-2);
	end
	FF = (std(ADwd2)/std(ADwd1))/(std(ADwd1)/std(ADwd0));
	%complexity
	features(itr,4*numEEG+d) = FF;
end
Results
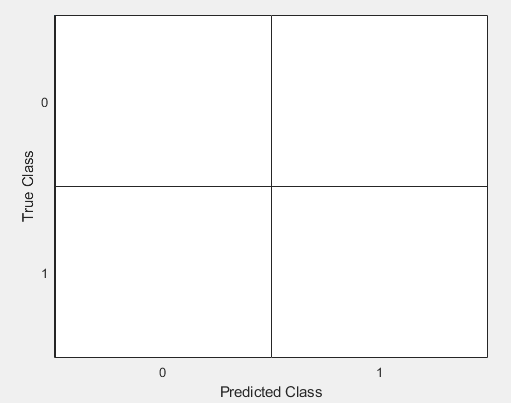
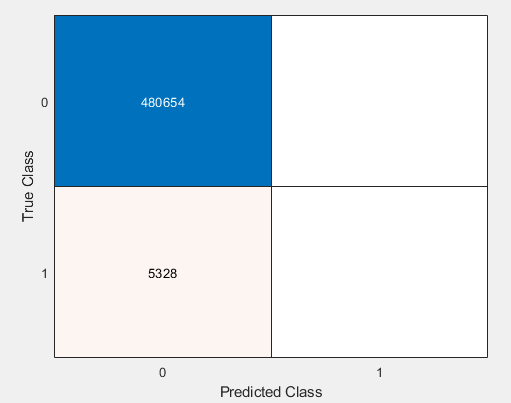
While testing different ways of finding labels and extracting features, our outputs varied in result constantly. A few of our intermediate, rather laughable, confusion matrixes are shown below that we had the displeasure to see after our program would finish. The rightmost classifying no events at all, the middle prediciting nearly every event as a braking event, and the leftmost predicting only non-braking events.
|
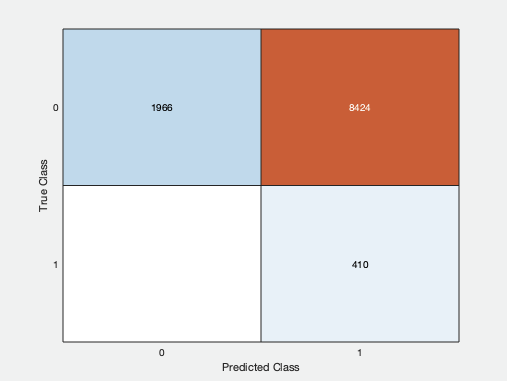
Eventually, once implementing the bottom two pieces of code listed above, our confusion matrix and ROC curve managed to output as such:

Our final confusion matrix, with a braking event recall of 92.9%, non-braking event recall of 98.2%, precision of 69.4%, and F1 score of 79.4%..
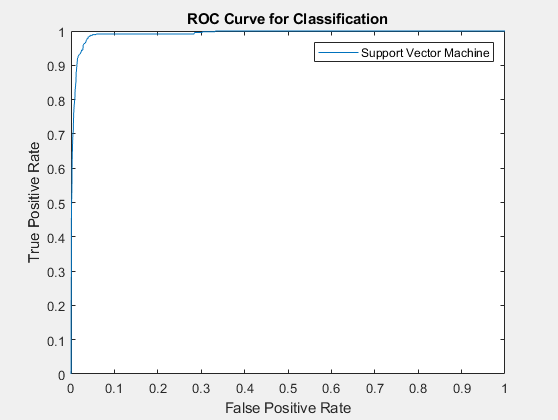
Our final ROC curve displaying the high rate of accuracy of our True Positive classification by following along the left-hand border, then the top border of the plot.
Conclusions
Over the course of our project, we overcame many challenges and hurdles to arrive at our final result which we are very satisfied with. Though, in hindsight some aspects of the project we would have certainly experimented more with given additional time would include a different classifier to observe the possible benefits or better outcome that could have been possible. We had debated a lot in the first few weeks of the project before arriving to the point of implementing a classifier whether to go with SVM, PDA, Naive Bayes, etc. but decided to trust and expand upon our initial execution of a Support Vector Machine. Along with this, we would have liked to attempt classification of an EEG signal outside of our employed dataset. After choosing our dataset before starting the project, we found numerous other simulated driving related EEG datasets that required EULAs from all project members, signed and sent them, then attempted to reach out to the researchers who constructed said datasets, though never heard a response back from any of them and unfortunately were not able to try out our finished classifier on anything but our initial data. All in all, we thoroughly enjoyed the entire process of this project, it certainly challenged us in an area of computer science all group members were interested with going into it, and remain very interested in after the fact.