CS 385 : Driving Logic
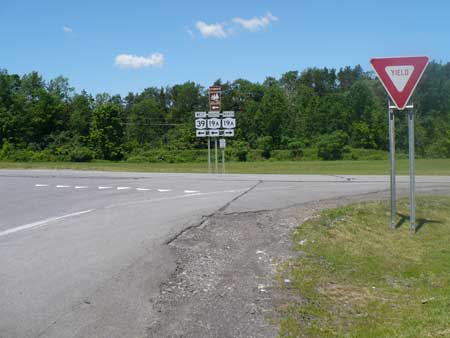
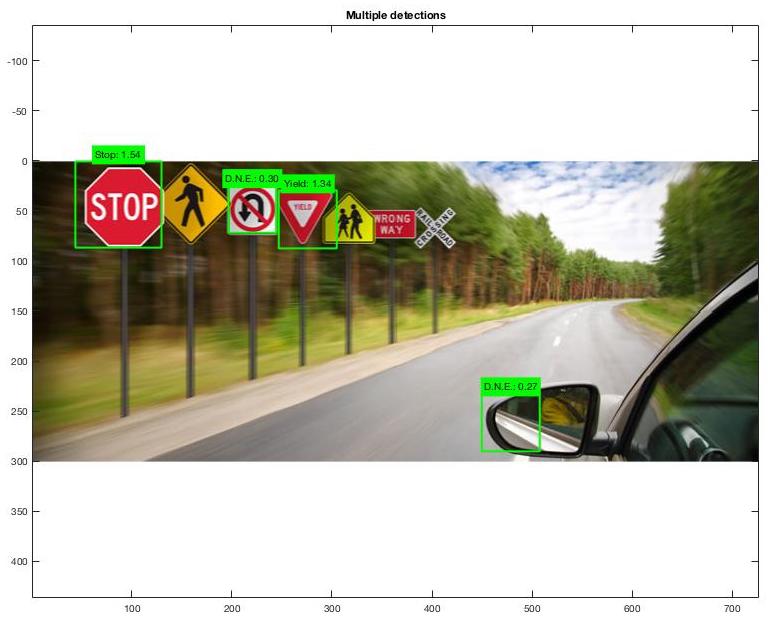
Example of images we can use to detect signs.
Introduction
The purpose of this project is for a car to capture pictures of it's surroundings and be able to identify street signs from multiple angles even if they are partially obstructed. You can see an example of an image that our program would use as an input to the right. We can identify the following signs:
- Stop signs
- Yeild signs
- Do Not Enter signs
- Speed Limit signs
Our program will then store and order the signs in order from closest to farthest. Our program will also be able to read speed limit signs in order to tell the car how fast to go.
Approach/Algorithms
Image Training:
We implemented SVM training with negative data mining. This method constructs classifications for a specified sign using images we provide that contain the specific sign. From there we use vl_hog to get features of the images. After we know the features, the program will look at images we provide that do not contain the image. The program will identify a patch from the image of what it thinks have the same features as the specified sign and create a negative example from that patch and add them to our training set. After going through the negative images and saving the false positive patches, the program will go through all the images again with the updated training set. It will go throgh the images for a specified amount of iterations. The amount of false positives will decrease every time we iterate through the training images. Below is each step with images to show the the process.
- Produces classifications for each sign with positive data we provide.
- We then computed HOG features from the positive images
- Afterwards, we iterate through the negative images and train an SVM Model
- Lastly, we plot the HOG Model
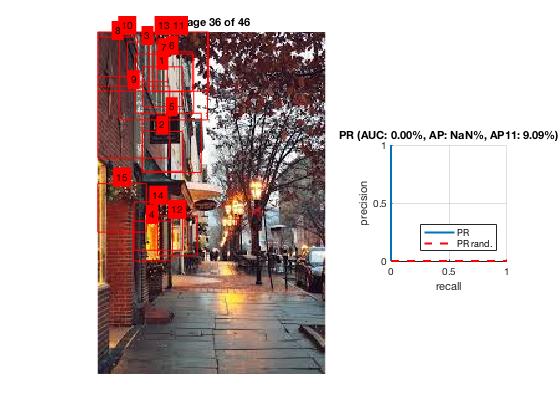
- Lastly, we mine the hard negatives for the next iteration
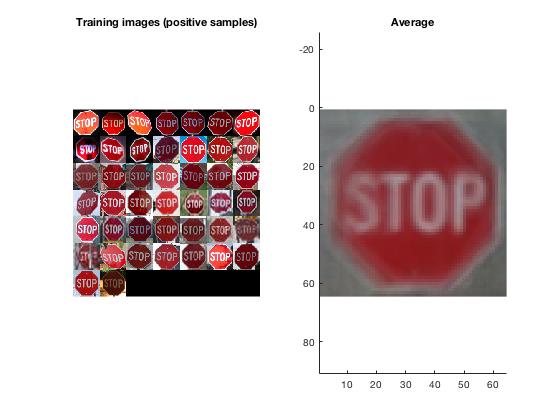
Example of step 1
Example of step 3
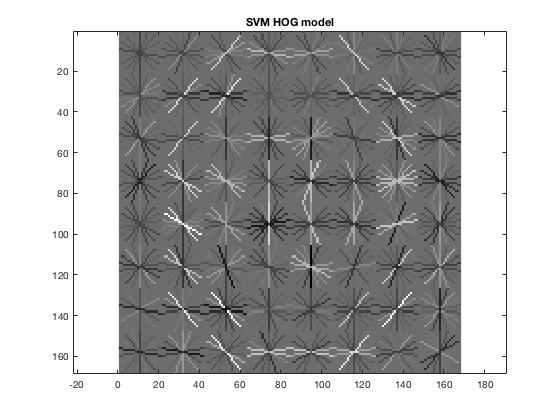
Example of step 4
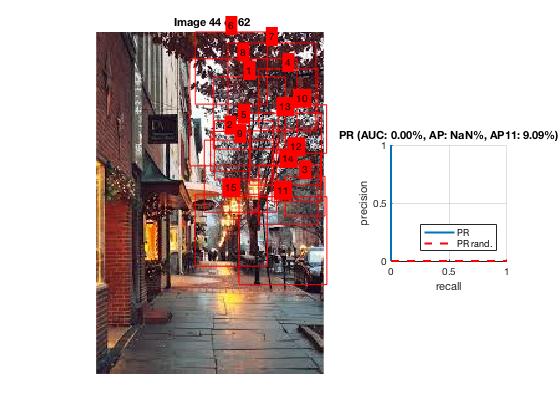
Example of step 5
Object Detection:
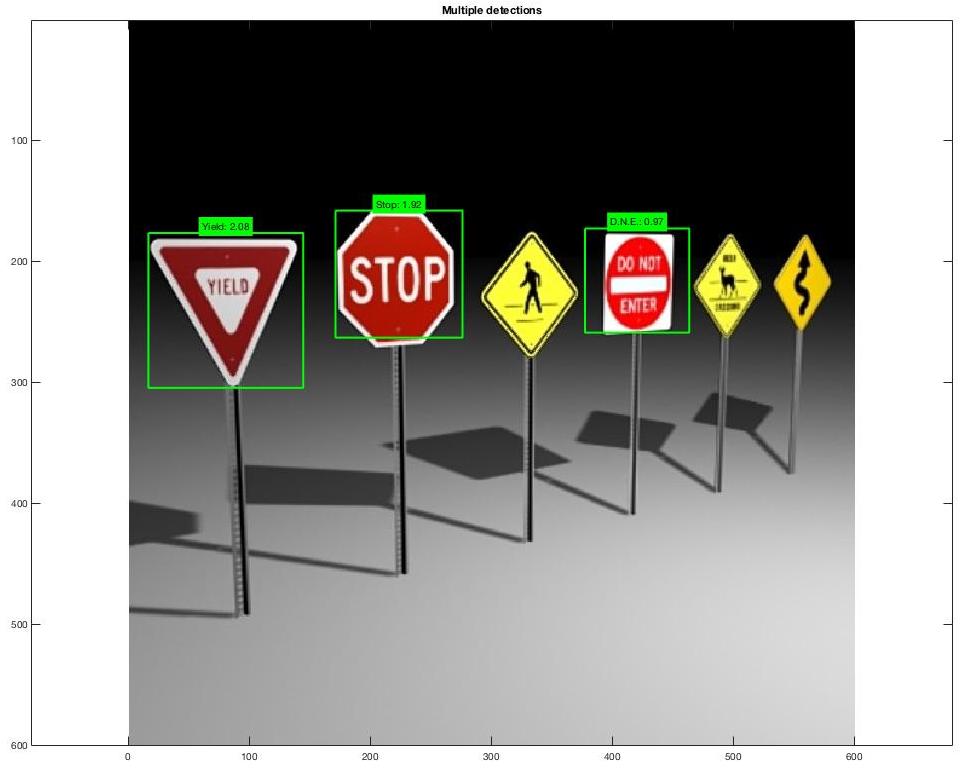
After training our program to know what each sign looks like we can give it images to detect. Our program starts by reading each test image as an input and converting it to single precision.We then detect the possible locations for the sign using a sliding window. After we get all the possible sign locations, our program takes out all the possible locations that have a score less than a specific amout that varies for the different signs. We then go through each bounding box and detect the boxes that overlap. We compare the scores and keep the score that is higher. The score represents the likelihood that the detected sign is accurate. The scores are on a scale from -1 to 3. Once our program has the desired bounding boxes we plot each box for the image.
- Read each image as an input and convert it to single precision
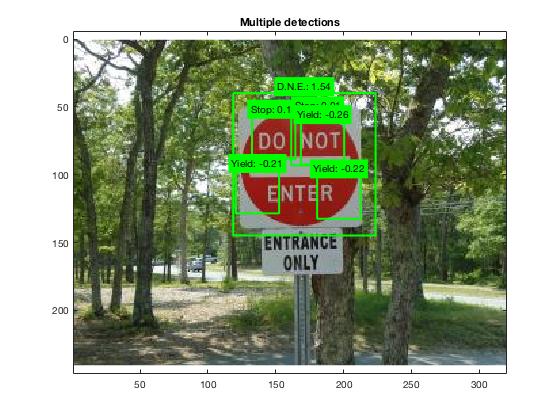
- Detect the possible sign locations using a sliding window
- Compare the results and handle overlapping signs to increase accuracy
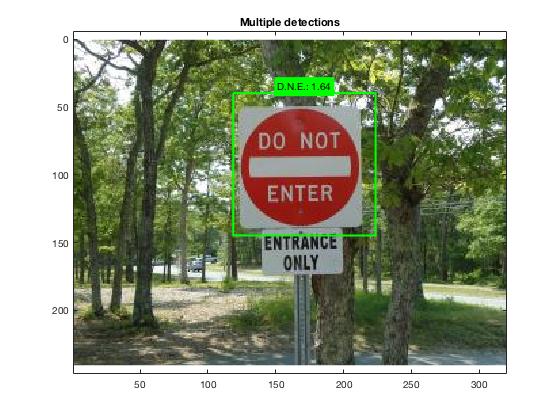
- Plot boxes for each sign in the image

Example of step 1
Example of step 3
Example of step 4
Text Recognition:
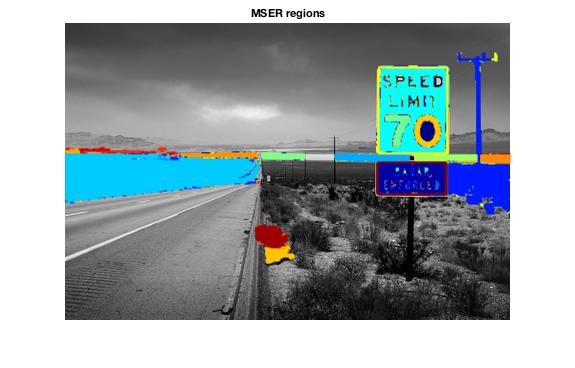
To read speed limit signs we use the Maximally Stable External Regions. We use this to detect different regions in the image. Once we have the different regions we remove the non-text regions based on geometric properties. We then use stroke width variation to refine our regions once more. After we have seperated the text from non text we merge the results from the two previous steps to get our final detection result. Once we have our final detection result we can use OCR (Obtical character recognition) to detect numbers within our text regions.
- Input the image and use the Maximally Stable Extremal Regions (MSER) algorithm to find regions
- Remove Non-Text Regions Based On Geometric Properties
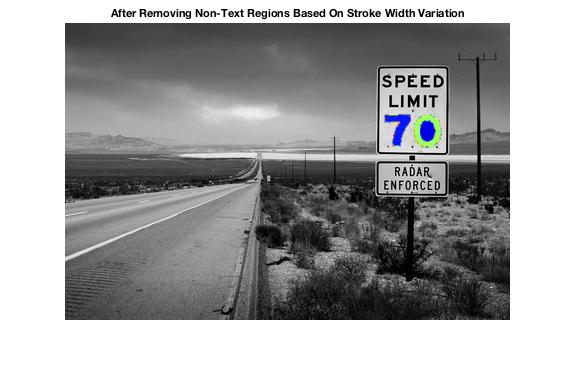
- Remove Non-Text Regions Based On Stroke Width Variation
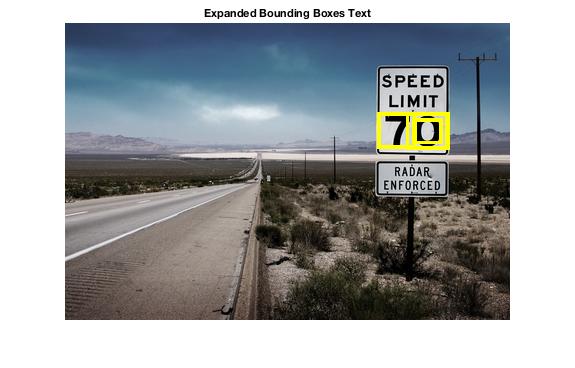
- Merge Text Regions For Final Detection Result
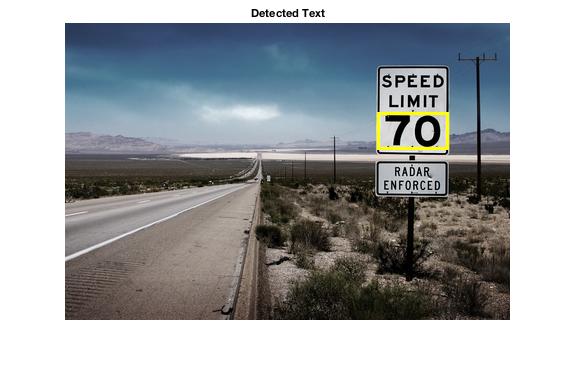
- Recognize Detected Text Using OCR
Example of step 1

Example of step 2
Example of step 3
Example of step 4
Example of step 5
Results
The good:
|
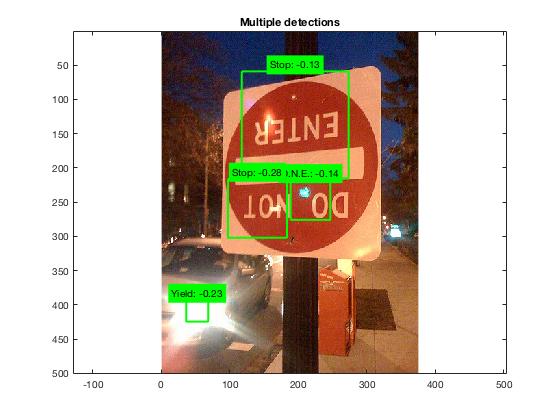
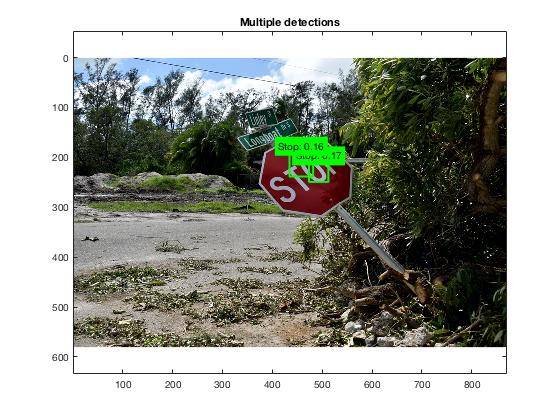
The bad:
|
There are multiple reasons why some pictures work better than others. The angle of the image along with the rotation has a big factor to the program detecting the correct sign or detecting a sign at all. If the sign takes up too much of the image the sliding window will not be able to detect the sign.
Conclusion
Our methods are mostly successful. We wanted to be able to detect certain street signs and put them in order of distance away from the car. Our program does do this. However, given more time it would have been beneficial to train an SVM model for each number. This would have made our text recognition much more accurate. Training an SVM model for each number would have taken much longer than the time we had to complete this project. To increase our accuracy we gathered and used more positive images than we needed but it got the job done.
References
- http://www.robots.ox.ac.uk/~vgg/practicals/category-detection/index.html
- http://cs.brown.edu/courses/cs143/2011/results/final/sethg/
- https://www.mathworks.com/help/vision/examples/automatically-detect-and-recognize-text-in-natural-images.html