Peaceful Deer Hunting (Steven,
Justin, Jon)
CS
385 : Animal Detection using Histogram of Oriented
Gradients
As our final project we
decided to work on detecting a few different animals from the Sonoma State University
Preserves data set. The animals we chose to focus on were squirrels(Justin),
bobcats(Jon), and deer(Steven). The majority of the examples will be showing in
this presentation will be of squirrels. For the project we are using HOG(Histogram
of Oriented Gradients) to train the image detection.
Dr. Gill provided us access
to the SSU Preserves data set that Dr. Christopher Halle has collected. The
images are from a trail in the preserves that are taken from motion detected
with daytime photos in regular colour, and nighttime
photos are collected with a type of night-vision. Though we were instructed to
not use the preserves data as training and rather to collect images from online
or other databases. The squirrel and deer images came from Image-Net, and the
bobcat images were collected from Google Images.
We started off our project
by working through an image detection tutorial from Oxford Visual Geometry
Group
(http://www.robots.ox.ac.uk/~vgg/practicals/category-detection/#step-10-loading-the-training-data).
While the tutorial was helpful for getting us on the right track at the start
of the project I think it hampered us later on, because of it obfuscating some
of the finer details about the calculations that were being done. We ran into
some issue particularly when it came to Negative Deep Mining. The Negative Deep
Mining was the most computationally intensive portion of the assignment.
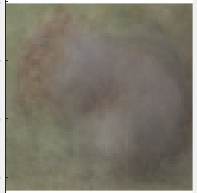
Method
Bringing in positives. Constucting a mean. Notice the impact of slight variations
in pose of the bobcat, compared to the smooth, clean sign training data
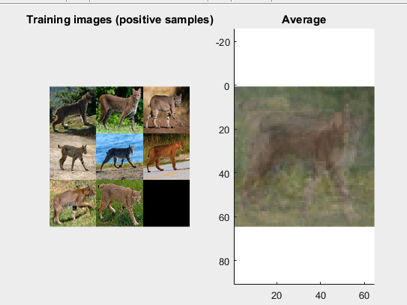
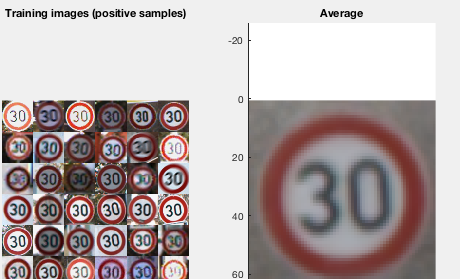
The signs are uniform, all front
facing, nearly rotationally identical, and highly prevalent in the environment.
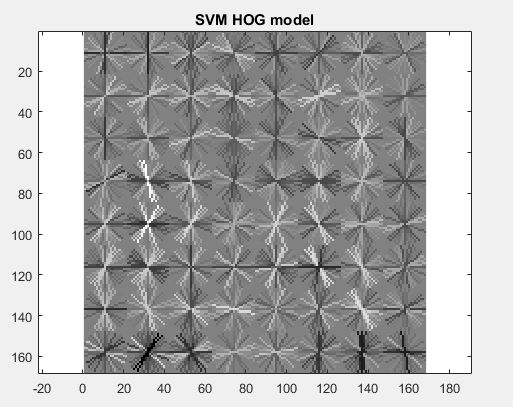
Extract HOG features, hog cell size
can be altered. A histogram of gradient directions is compiled for each cell of
an image. The descriptor is a concatenation of these histograms
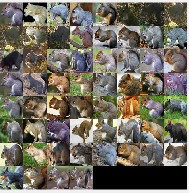
For each animal, we created a
positive training examples by simply taking the bounding box (or the entire
cropped image, in the tutorial example), but creating negative examples is
another story. The method we used is to generate random bounding boxes on the explictely negative training images provided, which do not
contain the animals at all. From these results, we can take the top scoring
false positives, and add them to the bank of negative to reduce the amount of
false positives encountered.
Results
The first training process used 100 images and 50 negatives (which
took 1.25 hrs to mine)
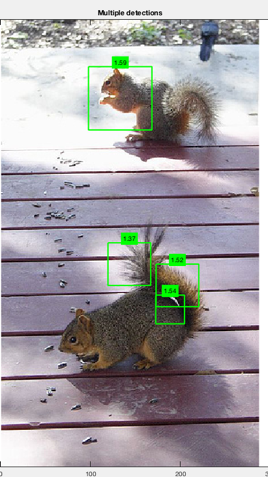
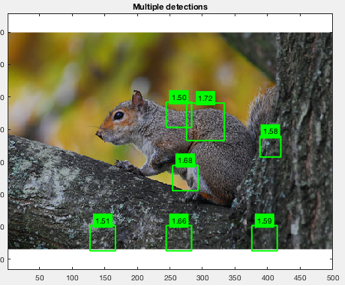
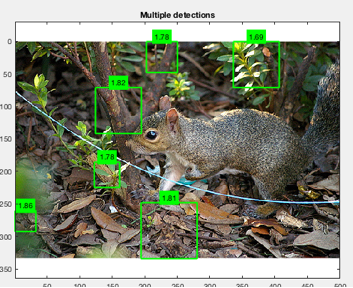
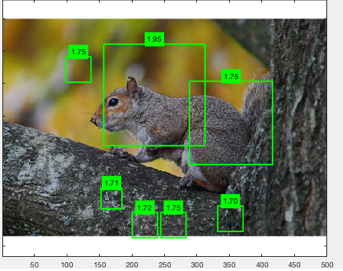
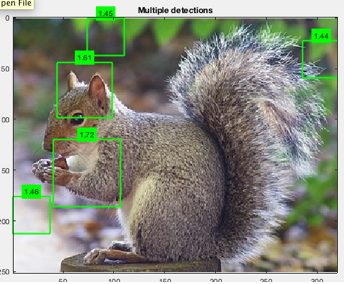
The best case involve multiple positives on parts
of the squirrel, or a single square on a part of the squirrel.
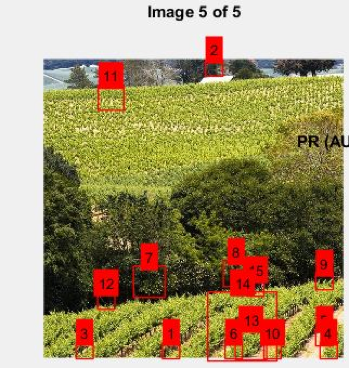
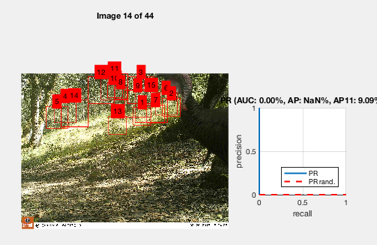
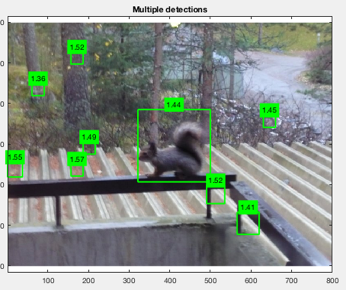
In the worst case there were false positives
everywhere:
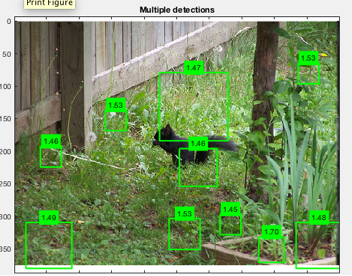
Given so many false positives in the previous attempts,
I went back to the images I’d cropped with the intent to make them all
perfectly square, discarding those that couldn’t be. I added additional images
from Google of the Western Gray squirrel ( native to northern california ), and
found a few squirrel side shots from the SSU preserves set.
Before running the next test ( which takes 1.5
hours to complete!! ), I also flipped all cropped training images horizontally
so the squirrel was facing to the left, and removed right-facing images with
aux border files, and got more restrictive by removing ‘nearly-sideways’ images
that were slightly rotated at 3/4 view. For the next sprint I would like to
create symmetric HOG templates to handle this problem.
Here’s an image of the hard-negative mining process.
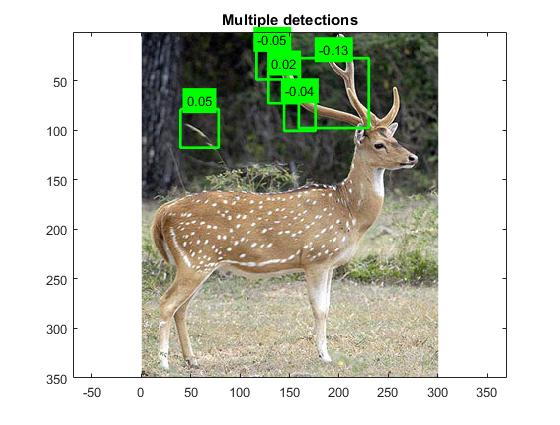
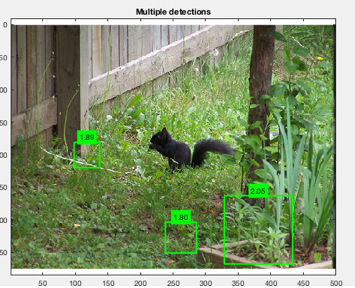
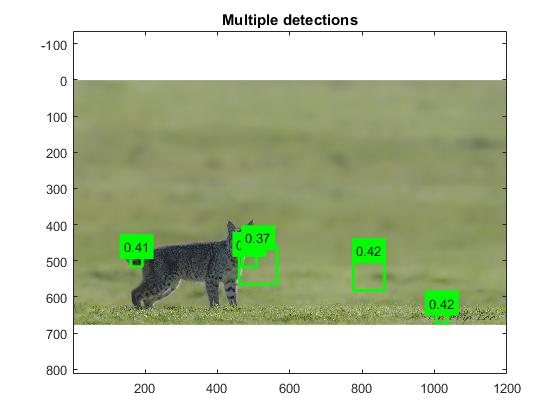
Here are a series of new test image results after
mining on the all left-facing cropped images:
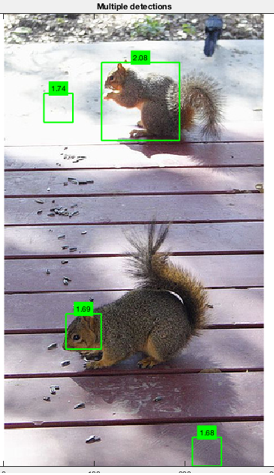
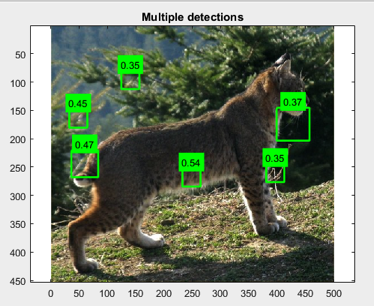
The results always seem to be better on images
like this having some texture consistency in the background.
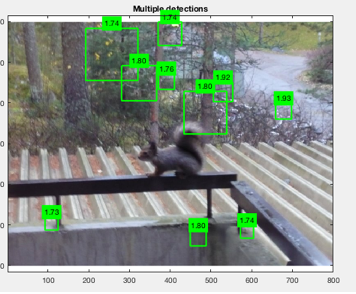
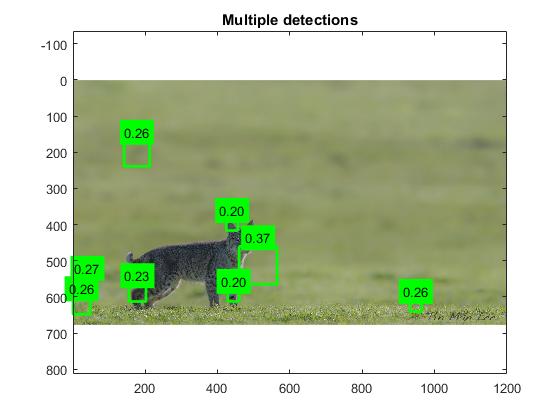
The greater the texture variety, the more false
positives there seem to be.
The new training with left-facing images did not
improve results here.
Dismayed by the poor results, we decided to take
a closer look into the NaN errors produced during during the hard
negative mining process, and two major problems: 1) during code that
evaluateModel.m is running, it seems that the current images in trainImage(i)
is being checked to see if it is in the set of trainBoxImages, if not it
ignores it completely; 2) even if the images are the same, detect.m still
ignores them if they have different directory locations. To remediate the
problem, I had to go back to the drawing board and ended up tracing through var
mutations throughout the set of source files. In the end, I threw out
pre-cropped images and only allowed full-size images having tandem bounding box
files for my trainBoxImages, and then used a subset of those images for
trainImages. Only some of the images had pre-fabricated bounding box files ( for
those I wrote a script to extract the bounds from the .xml files); for many
more I had to manually display the pixel info to find the bounds dimensions and
then manually create .txt files.
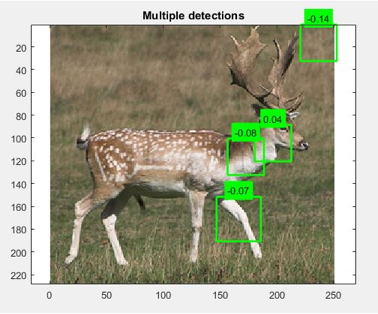
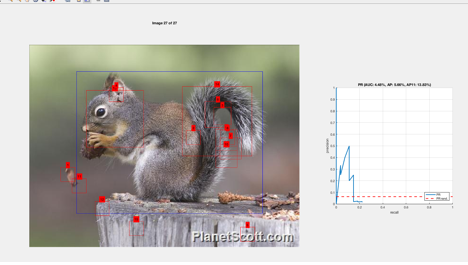
As a result, the negative mining process changed
in a few ways: 1) it actually began displaying numerical percentages; 2) It
showed a blue bounding box around the object ( sourced from trainBoxes ) 3)
Occasionally it would draw another green box around the object.
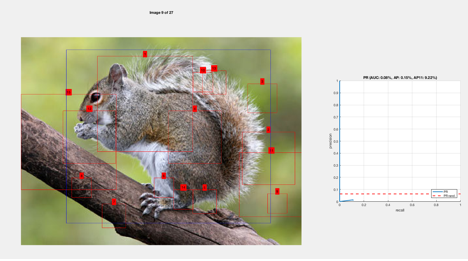
The red represents areas the SVM learned are not
target objects. The blue represents what we are trying to teach the SVM.
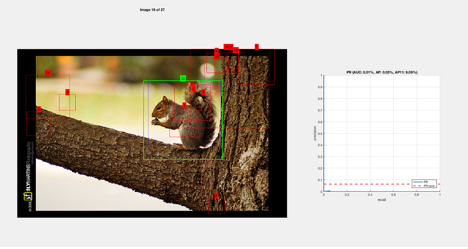
And for the first time, we see a green line,
which represents the SVM confirming that it learned to detect the object in
this image.
I tried out just about every combination of
hogCellSize, variant and numOrientations and settled on 12, dallalTriggs and
21, respectively. Still, even with these settings and all objects facing the
left, my results were full of false positives.
I suspected that the bushiness of the
squirrels tails and their varying position was introducing too much variance
into the SVM, so as a last resort, I created a second image dataset with the
tails cropped out.
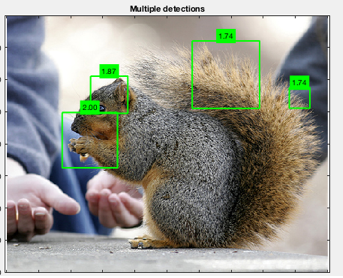
This did in fact increase the rate of detection
from ~15% to about 30%. Instead of only 3-4 images detected in a set of 24, the
value went up to 7.
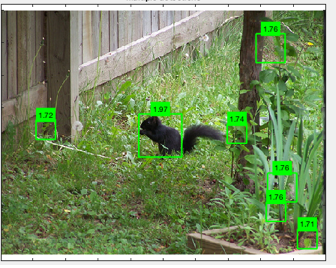
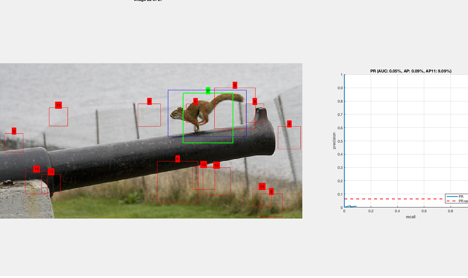
And it finally found the black squirrel, in the following
image, albeit swimming in a sea of false positives.
In the end, however, when I finally tested it
with SSU preserves data, it did not find the squirrel very well:
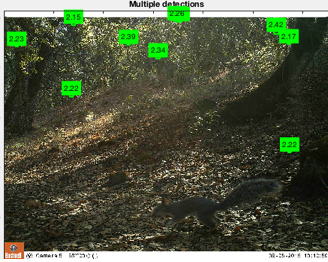
I think part of this has to do with the size of
all except 5 ( out of 54 ) of the trainBoxImages being smaller than the
SSU preserves image sizes, which are each 600K. The median trainBoxImages size
is 158K.
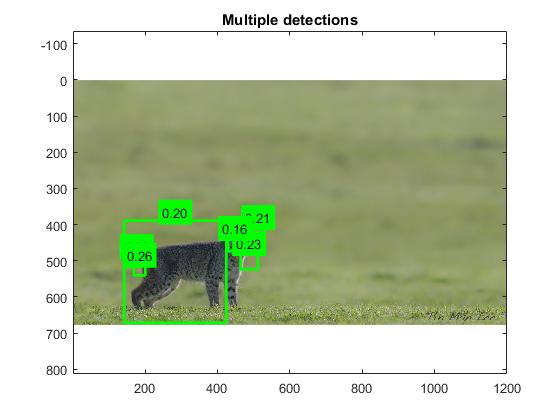
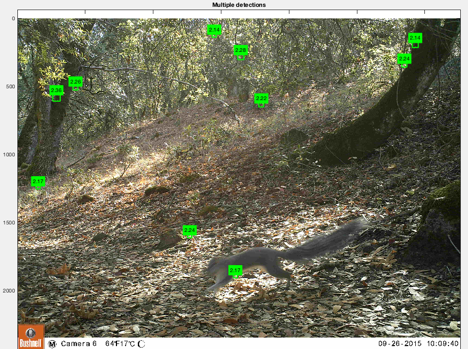
As a final test, I tried shrinking the SSU images
to make them closer to the median dimensions in the trainBox image set, and
found that it changed the detection results.
This is with the image size halved.
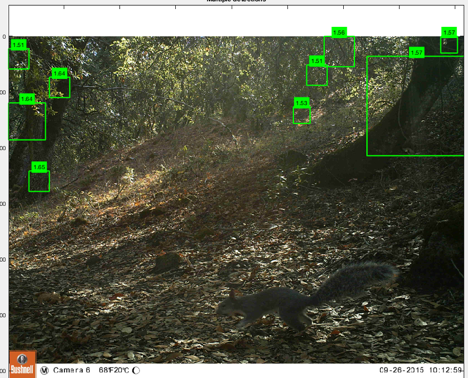
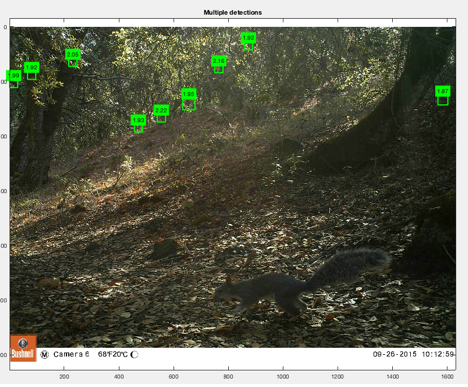
Image size quartered
The results show that the rectangles get bigger
as the scale decreases.
Conclusion
I suspect that a
lot of our detection issues in this project relates to the fact that the SVM
was trained with lower resolution patches, which the classifier may have then
tended to prefer over larger resolution patches. This could indicate that the
vl_hog approach in this tutorial is not entirely scale-invariant.
Also, in retrospect
I believe that our testing plan, in omitting all SSU preserves testing data
from the training, may have subverted the success of the classifier accuracy in
this project. Here�s why:
The image set terrain
and breeds of squirrel reflects the internet�s representation of the squirrel
population, which do not adequately represent that of the population and
terrain in northern California. To handle that effectively, without too
narrowly training the classifier, it may need a much larger sample size of code
words.
I believe that in
order to remedy this, we would need to add some negative images that contain
the terrain.
As a final test, I
added 3 squirrel photos from the SSU preserves dataset, which did not
significantly improve the results. It could have been because the additional 3
images only represent 5% of the total of 60 images.
I think if I had
trained the entire classifier using strictly northern California and/or SSU
data, the results would have been much more accurate, as it would reduce the
amount of variety considerably during the training process. I think that the
signs tutorial was able to achieve so much accuracy because: 1) the signs fit
almost perfectly into square dimensions; 2) the backgrounds were all similar (
same the same rural/suburban area with a consistent environment) 3) The angles
of the signs were all perfectly forward-facing and nearly perfectly aligned.
Animals in wildlife shots can take so many more varying positions, and
squirrels in particular have a tail position that can go anywhere. To truly
model a squirrel classifier after the signs tutorial, one would need labels
with: tails pointing at 3 O�clock, 12 O�clock, and every other direction,
just as the signs are labeled for right arrow, right-down arrow, right-up
arrow, etc. In short, we would need many many more squirrel images from
northern California to be able to accurately train the SVM.